

Mapping
Early Development Instrument
The Early Development Instrument is a tool that Make Children First uses to help us understand how children in our community are doing at Kindergarten entry. In BC, the data is managed by the Human Early Learning Partnership at the University of British Columbia. See below for their explanation of the tool, how data is collected and why it is important.
See the last 2 Waves of Kamloops data by clicking on the Community Summaries or looking at all the data maps.
Visit http://earlylearning.ubc.ca/edi for more information on the Early Development Instrument.
What is the Early Development Instrument?
The Early Development Instrument (EDI) is a questionnaire developed by Dr. Dan Offord and Dr. Magdalena Janus at the Offord Centre for Child Studies at McMaster University.
The questionnaire has 104 questions and measures five core areas of early child development that are known to be good predictors of adult health, education and social outcomes:
- Physical Health & Well-Being
Sample EDI questions: Can the child hold a pencil? Is the child on time for school each day? - Language & Cognitive Developmentz
Sample EDI questions: Is the child interested in reading and writing? Can the child count and recognize numbers? - Social Competence
Sample EDI questions: Does the child share with others? Is the child self-confident? Will he/she invite bystanders to join in a game? - Emotional Maturity
Sample EDI questions: Is the child able to concentrate? Is the child aggressive or angry? Is the child impulsive (does he/she act without thinking)? - Communication Skills & General Knowledge
Sample EDI questions: Can the child tell a short story? Can the child communicate with adults and children?
EDI questionnaires are completed by kindergarten teachers from across British Columbia for all children in their classes. They are filled out in February, after teachers have had the chance to get to know their students. This ensures that teachers are able to answer the questions knowledgeably.
Why look at populations, not individuals?
Although Kindergarten teachers complete an EDI questionnaire for each of their students, the results are not used to evaluate individual children, nor are they used to rank teachers, neighbourhoods, schools or school districts in any way.
The EDI is a population-level research tool. As such, it measures developmental change or trends in populations of children at varied geographies: provincial, regional and neighbourhood. This allows us to see variations in children's vulnerability across time and location. Understanding how populations of children are doing allows program delivery organizations and policy makers to make informed decisions about investments in new or adapted programs and in broad policies that support children and families.
What does the EDI measure?
The questions on the EDI measure core areas of early child development that are known to be good predictors of adult health, education and social outcomes. By evaluating data gathered from the EDI questionnaire, researchers are able to measure population-based vulnerability rates by geographical area. As a research institute that focuses on population health, our definition of child vulnerability refers to the portion of the population which, without additional support and care, may experience future challenges in school and society. HELP's Vulnerability on the EDI fact sheet provides specific information about vulnerability.
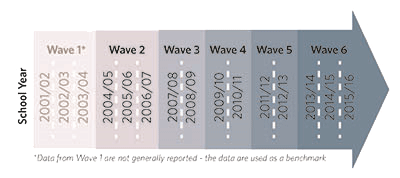
How often are EDI data collected?
EDI data are collected in groups called waves. Each wave is comprised of data collected from several consecutive school years. In order for our data analysts to accurately measure statistically significant changes in the data over time, school districts with smaller numbers of kindergarten students participate annually. Medium and larger school districts participate less frequently.
How are EDI data used?
HELP creates maps, graphics and reports that summarize EDI results at provincial, regional and neighbourhood levels. Using these resources, communities, schools and governments are better able to understand how children are currently faring across the province. This allows supports and services to be tailored for families and young children where and when they are needed. To date, more than 700 early child development initiatives and community projects have been supported by EDI results.
Who uses EDI Data?
- Early childhood coalitions, early child development workers, and school representatives use EDI data to inform their work with children and young families by identifying strengths and needs within their communities. Using EDI data allows local groups to better advocate for changes to policies and funding.
- Ministries of Children and Family Development, Education and Health use EDI maps and data to plan early childhood investment, policy and program development. B.C. Ministries also use EDI data for program evaluation.
- Researchers use EDI data to address important questions and formulate new research agendas to help uncover more knowledge about the genetic, biological, and social determinants of children's health, well-being and development. Their research, in turn, helps to inform policy and program development.
Community Mapping
The Kamloops / Thompson region is thriving. This, among other elements, is a key finding of the Community Mapping Study.
In cooperation with Statistics Canada and Human Resources and Social Development Canada, the Community Mapping Study has captured a highly detailed glimpse of Kamloops/Thompson. This glimpse will undoubtedly serve as a foundation from which the best services and resources can thrive.
Education and income levels paint an optimistic picture and population levels are on the rise. This type of positive growth, while encouraging, is sometimes accompanied by the need for social adjustment.
Availability and scope of resources help transition and support healthy communities. Barriers such as language, culture, transportation and isolation (whether geographical or social) may play an increasing role in the needs of a developing region.
Download the report as a PDF or Powerpoint Presentation